
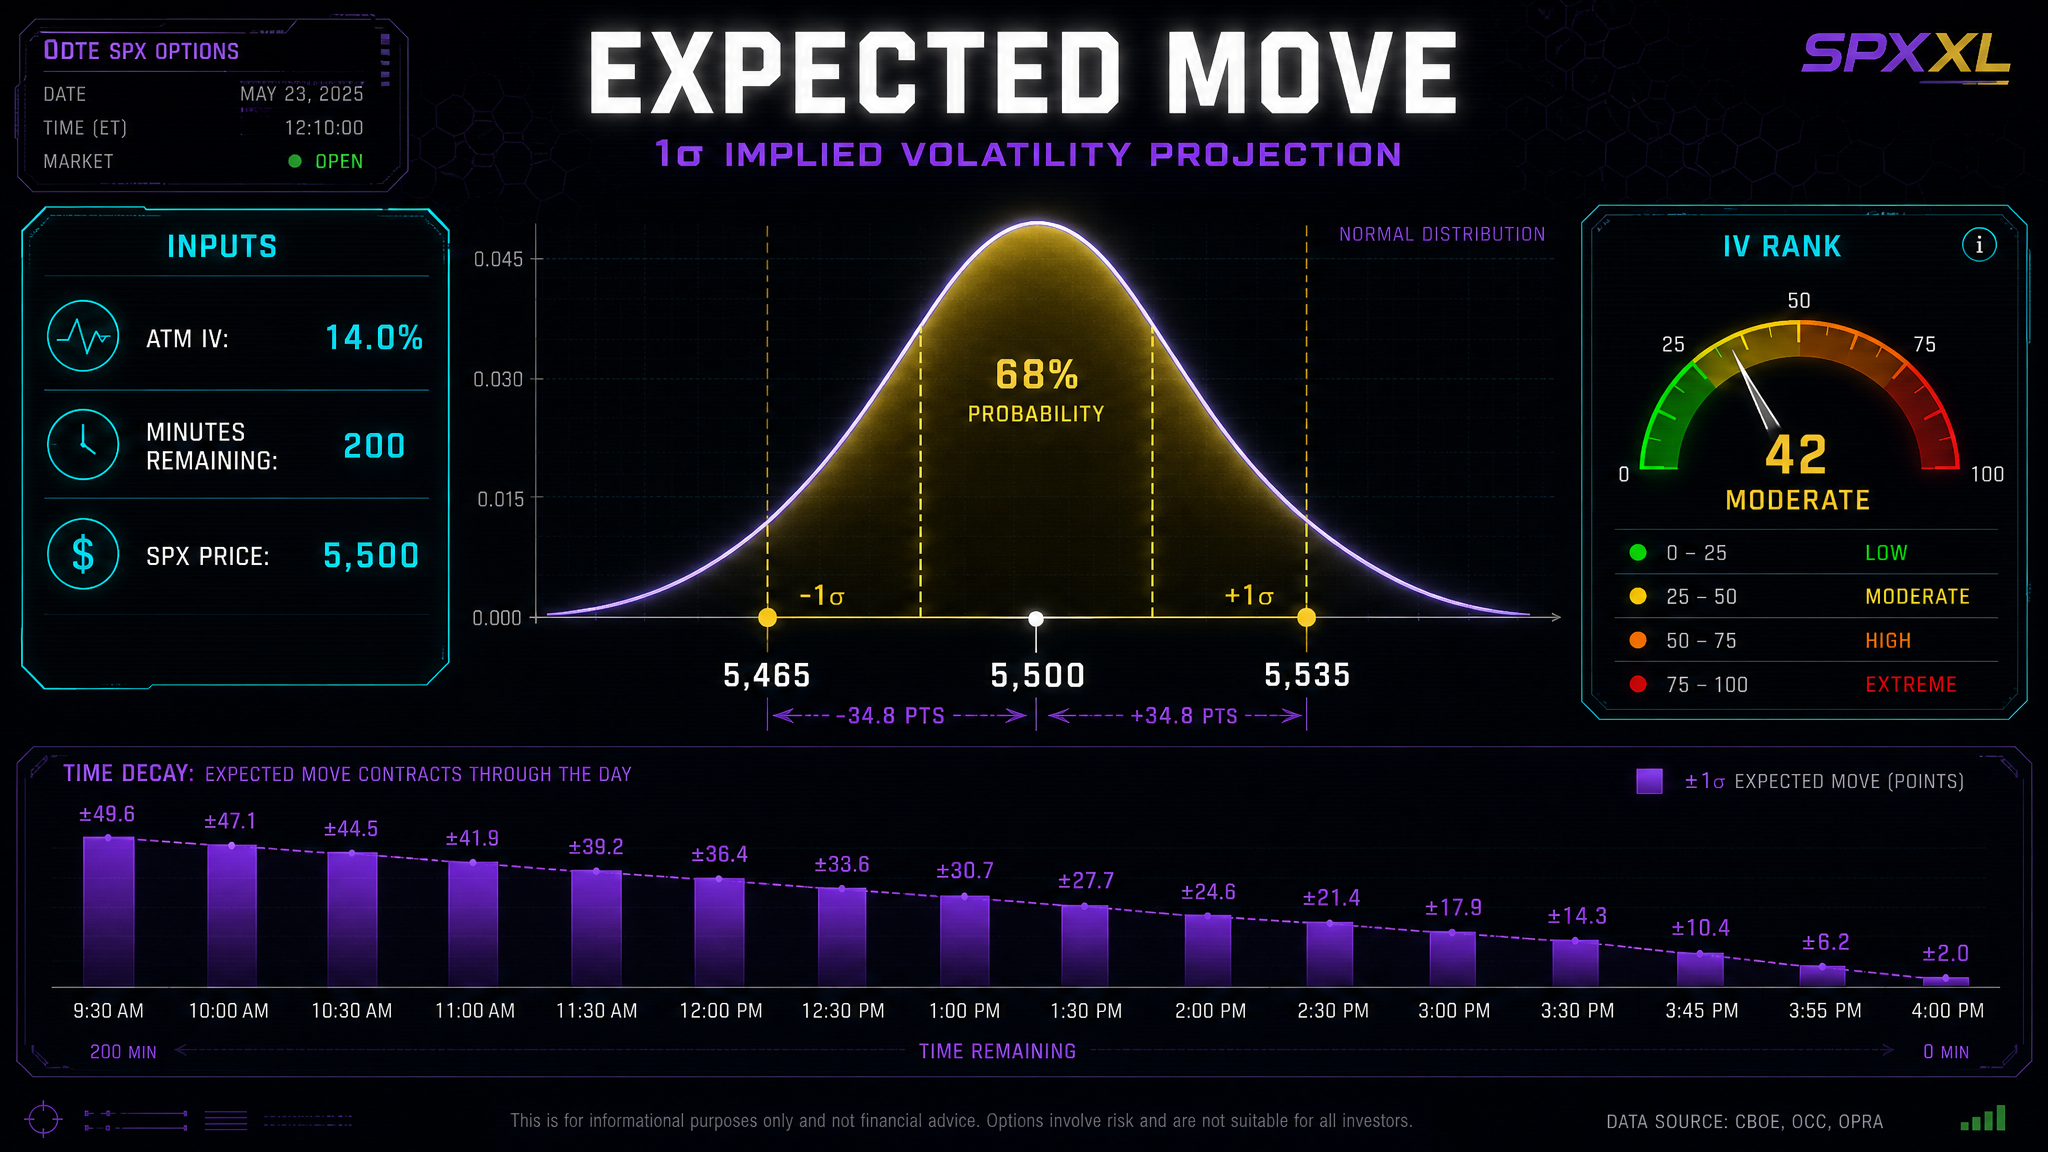
What Is the Expected Move?
The Expected Move is the options market's own forecast of how far SPX will travel before the closing bell, expressed as a ±point value. It represents the 1-standard-deviation (1σ) range — the zone where price has approximately a 68% probability of settling by expiration.
When you build a Debit Condor with your inner strikes outside the expected move, the options market itself is telling you there's more than a 68% chance SPX finishes inside your win zone. That is your mathematical edge.
Platforms like ThinkorSwim display this as a static ±number that updates periodically. SPXXL surfaces it differently: live, recalibrated every 30 seconds, color-coded by IV Rank, with real-time minutes-remaining decay — integrated directly into the Close Zone™ widget where you make trade decisions.
The expected move isn't a prediction. It's a probability envelope derived from what market participants are actually paying for options right now. It tells you where the smart money thinks SPX won't go — and that's more valuable than where it will.
The Formula: IV → ±Points in One Equation
The math behind the expected move is elegant and universal. Every options platform uses some version of it — but SPXXL makes it actionable in real time:
The Expected Move Formula
EM = Price × ATM_IVannual × √(minsLeft ÷ 98,280)
Price
Current SPX level
ATM IV
Annualized implied vol
√Time
Square root of time remaining
The 98,280 constant equals 252 trading days × 390 minutes per day — the total trading minutes in a year. This scales the annualized implied volatility down to exactly the time remaining in the current session.
Live Example
SPX at 5500 • ATM IV: 14% • 200 minutes remaining
Session IV = 0.14 × √(200 ÷ 98,280) = 0.00632
Expected Move = 5500 × 0.00632 = ±34.8 pts
Expected Range: 5465 – 5535
Notice how the formula is time-dependent. As minutes tick away, the expected move contracts. This is the same mathematical force that drives theta decay — and SPXXL shows you both in real time.
Why the Expected Move Shrinks All Day
The expected move isn't static. It decays in real time as the session progresses, following the same square-root-of-time relationship that governs all option pricing:
9:30 AM
±35 pts
390 min • 100%
11:30 AM
±29 pts
270 min • 83%
2:00 PM
±19 pts
120 min • 55%
3:30 PM
±10 pts
30 min • 28%
By 3:30 PM, the expected move has shrunk to just 28% of its opening size. SPX is "locked in" near its closing level — and SPXXL shows you this compression in real time, every 30 seconds.
This real-time decay visualization is unique to SPXXL. ThinkorSwim shows a static expected move. SPXXL shows you the expected move breathing, contracting, tightening — so you can time your entries and exits to the minute.
For Debit Condor traders, this is the win zone tightening made visible. For debit spread buyers, it tells you exactly when directional bets become cheapest. For Butterfly traders, it shows when the probability window is narrowest — maximum precision.
IV Rank: Cheap vs. Expensive Volatility
The expected move alone doesn't tell you if volatility is high or low — it just reflects current pricing. IV Rank adds the critical context: where current implied volatility sits relative to the past 52 weeks, on a 0–100 scale.
Options are cheap. Expected move likely understates actual movement. Debit spreads and directional plays are attractively priced.
Normal volatility regime. Expected move is well-calibrated. Standard strike selection applies.
Options are expensive. Expected move likely overstates the actual move. Debit Condors have an edge — place your inner strikes outside 1σ for maximum probability.
Volatility is at 52-week highs. Options are very expensive. Debit Condors have their strongest mathematical edge — and the long outer wings you buy cap the tail risk.
SPXXL color-codes the expected move by IV Rank so you know at a glance whether today's implied volatility is historically cheap or expensive. This turns a raw number into an actionable intelligence signal.
Strike Selection: The 1σ Edge
Here's where the expected move becomes a trading weapon. The 1σ boundary tells you exactly where to place your strikes:
Placing your inner strikes outside the expected move means the options market is pricing a <32% chance SPX reaches them — a >68% chance it finishes inside your Debit Condor win zone. This is not a guess — it's the market's own probability estimate.
Debit Condor
Place your inner (sold) strikes at or beyond the 1σ boundary, with long protective wings you buy further out. Center the win zone within the range.
Best when: Balanced Day + HIGH IV Rank = maximum probability
Bull Call / Bear Put Debit Spread
Buy the near strike and sell one further out to cheapen the cost. Use directional bias from session classification to choose Calls or Puts.
Best when: Trend Day or Expansion Day with clear direction
Butterfly
Body at Close Zone™ center. Wings at expected move boundaries for the full probability envelope.
Best when: Close Zone and Expected Move converging
Debit Spread
When IV is LOW, the expected move understates potential movement. Cheap debit spreads offer asymmetric reward.
Best when: LOW IV Rank + Trend Day classification
The expected move eliminates guesswork from strike selection. Instead of "I think 5500 won't get hit," you know "the options market prices a 68% chance SPX stays within ±35 points of here."
Four Strategies Powered by Expected Move
Debit Condor Outside 1σ
When IV Rank is HIGH or EXTREME, the expected move typically overstates the actual move. Build Debit Condors with your inner strikes beyond the 1σ boundary and long wings further out. The math is on your side: the win zone covers the high-probability range while the debit caps your risk.
Cheap Directional Bets on LOW IV
When IV Rank is LOW, the expected move underestimates potential. Debit spreads are cheap and offer asymmetric reward if the session turns into a Trend Day. SPXXL's classification tells you the probability — the low expected move tells you the options are priced to undershoot.
Precision Butterflies at Convergence
When the Expected Move and Close Zone™ agree on SPX's probable close, Butterflies placed at the convergence point capture the maximum probability edge. The expected move defines the width, the Close Zone defines the center.
Time-Decay Fade in Final Hour
As the expected move shrinks below ±10 points in the final 30–60 minutes, a Debit Condor with inner strikes just beyond this compressed range has an extreme probability of finishing inside its win zone. SPXXL shows you the exact ±points in real time so you can enter at maximum edge.
Expected Move vs. Close Zone™: When Both Agree
These are two complementary but distinct projections that serve different purposes:
| Expected Move | Close Zone™ | |
|---|---|---|
| Source | ATM implied volatility (pure math) | Multi-factor classification engine |
| Shape | Symmetric (±equal distance) | Can be asymmetric (skewed) |
| Inputs | Options chain pricing only | Session type, GEX, breadth, VWAP, historical patterns |
| Updates | Every 30 seconds | Every 30 seconds |
| Best For | Strike selection framework | Close location prediction |
When the Expected Move range and Close Zone™ overlap tightly, conviction is at its highest. The options market and SPXXL's classification engine agree on the probable close. SPXXL flags this convergence automatically.
Think of it this way: the Expected Move tells you how far SPX can move. The Close Zone tells you where it's likely to close. Together, they give you both the probability envelope and the directional bias — a complete framework for 0DTE structure selection.
Live on SPXXL: What You See
The Expected Move is surfaced inside the Close Zone™ widget on the SPXXL dashboard. Here's exactly what's displayed:
±Points
The 1σ expected move in SPX points (e.g., ±34.8). Updates every 30 seconds.
IV%
Annualized ATM implied volatility as a percentage (e.g., 14.0%). The raw IV input.
Expected Range
Current price ± expected move = upper and lower bounds (e.g., 5465 – 5535).
IV Rank
Color-coded label showing where IV sits vs 52-week range: LOW (green), MODERATE (gold), HIGH (orange), EXTREME (red).
Minutes Remaining
Real-time countdown of trading minutes left. Drives the expected move decay calculation.
When Tradier live options chain data is available, SPXXL computes ATM IV from actual bid/ask midpoint implied volatilities of the nearest strikes. When the chain is unavailable (pre-market or data outage), VIX serves as the fallback proxy — clearly labeled as "modeled" so you always know the data source.
Why No Other Platform Does This
Let's be direct about what exists today:
| Capability | SPXXL | TOS | SpotGamma |
|---|---|---|---|
| Real-time EM (≤30s refresh) | ✓ | — | — |
| IV Rank color-coded labels | ✓ | — | — |
| Minutes-remaining decay visible | ✓ | — | — |
| Session classification integration | ✓ | — | — |
| Close Zone™ convergence signal | ✓ | — | — |
| ±Points with strike context | ✓ | ✓ | — |
| IV% displayed | ✓ | ✓ | ✓ |
| GEX integration | ✓ | — | ✓ |
Other platforms show you implied volatility. SPXXL turns implied volatility into a decision framework — with real-time decay, regime classification, convergence signals, and session-type context that tells you not just how far SPX can move, but what kind of day determines whether it will.
Start Trading With the Edge — at No Cost
The Expected Move is available to all SPXXL users — free and paid — inside the Close Zone™ widget. It updates every 30 seconds during market hours, shows IV Rank context, and integrates with session classification data.
Most traders are guessing where to place their strikes. You don't have to. The options market has already priced the answer — SPXXL just makes it visible.
No cost. 5-Day Trial. Expected Move is available in Close Zone™ for all tiers.