
01What a Footprint Chart Actually Shows You
Every candle on your chart is a lie by omission. It tells you open, high, low, close — and hides the entire war that happened inside.
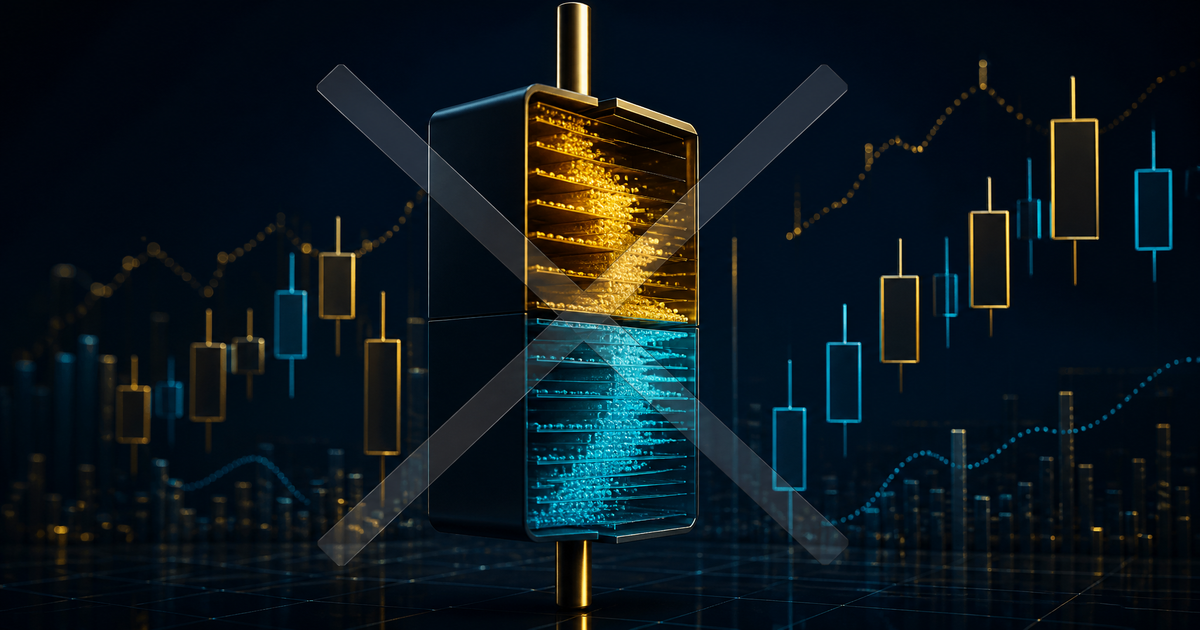
A Footprint Chart cracks that candle open. At every single price level within the bar, it shows you two numbers: how much volume hit the bid (sellers) and how much lifted the ask (buyers). The difference is the Delta at that price. The level where the most total volume traded is the Point of Control — the price the market "accepted" most.
Institutional traders don't care about candle patterns. They care about WHO is buying, WHO is selling, at WHAT urgency, and WHETHER the passive side is absorbing the aggression or folding. A Footprint Candle is the closest retail traders get to seeing that auction.
If you've heard the phrase "Order Flow" and wondered what it actually means — this is it. The real-time stream of transactions hitting the bid and the ask. Everything else — candles, moving averages, indicators — is a derivative of this raw data.
02The Five Signals Inside a Footprint Candle
1. Delta
The net difference between buy-side and sell-side volume at each price level. Positive Delta = aggressive buyers dominating. Negative = sellers. Cumulative Delta across the session is the running score of who's winning.
2. Imbalance
When one side overwhelms the other by a 3:1 ratio or more at a specific price. Buying Imbalance = demand overpowering supply at that level. Selling Imbalance = the reverse. A single Imbalance is noise — but when they stack, it's institutional.
3. Stacked Imbalance
Three or more consecutive price levels each showing a dominant Imbalance in the same direction. This is the strongest signal in Order Flow — it almost always represents large-lot institutional aggression being worked across a price range.
4. Absorption
When massive aggressive volume hits a price level but price doesn't move. Passive limit orders are absorbing the aggression — a hidden wall of institutional resting liquidity. When Absorption fails, the breakout is violent.
5. Delta Divergence
When price makes a new high but cumulative Delta doesn't confirm it — the aggression behind the move is exhausting. The rally is on fumes. This is the exhaustion signal that tells you the trend is dying before the chart shows it.
These five concepts are not obscure academic theory — they are the primary read that futures desks at institutional firms use every single day. The question is whether SPX traders can access the same data.
03The SPX Problem — Why You Can't Use Them
Here's the part most "Order Flow" content creators won't tell you.
Footprint Charts work on ES (the S&P 500 E-mini futures) because ES trades on the CME — a centralized exchange with a single, complete tape of every fill, every lot, every millisecond. Sierra Chart, Bookmap, and MotiveWave connect to that feed and render the Footprint.
SPX options trade on CBOE — not CME.
CBOE is a fragmented, electronic market. There is no single centralized tape of every SPX option fill with the bid×ask level detail that a Footprint Candle requires. The data is either unavailable to retail or prohibitively expensive and delayed.
This is not a minor technical limitation. It means the canonical "open Sierra Chart, watch the Footprint, trade Order Flow" workflow does NOT work for SPX options. If someone is selling you a course on "using Footprint Charts to trade SPX 0DTE," they're either using ES as a proxy (which introduces a correlation lag) or they're misrepresenting the data available.
I built SPXXL knowing this. The question was never "how do we get Footprint data on SPX?" — it was "how do we read the same institutional signals without it?"
04What SPXXL Reads Instead
Think of it this way: if you can't measure the wind directly, you watch the trees bend.
SPXXL reads the downstream EFFECTS of Order Flow — the observable consequences that institutional aggression leaves behind even when you can't see the tape itself:
None of these is a 1:1 replacement for a Footprint Candle. But combined, they read the same story: who is in control, whether the aggression is real, and whether the move has conviction. That's what matters for structuring a 0DTE trade.
05The 6-Step Order Flow Confirmation
I took the six canonical Order Flow signals from Footprint Chart analysis and mapped each one to the closest SPXXL engine proxy. The result is the new Order Flow Confirmation · 6-Step Read widget on the dashboard.
When all six confirm, the widget reads CONFLUENCE: CONFIRMED — the engine is seeing the kind of one-sided aggression that, on a Footprint Chart, would light up as stacked Imbalances with no Absorption blocking the move. That is a high-conviction trend continuation signal.
When the read is a range day, it says NO SETUP — SIT OUT. When there's mixed confirmation, it shows the fraction and labels it FORMING. The honesty is the point — the widget never forces a signal.
06When This Matters — and When It Doesn't
Order Flow analysis matters most on Trend Days and Liquidity Sweeps — the sessions where getting the direction wrong costs the most. On a Balanced Day where price rotates in a 15-point box, the Order Flow read is less actionable because there IS no dominant aggression.
This is why the widget's SIT OUT verdict is a feature, not a bug. It actively tells you when the Order Flow system has nothing to say — and on those days, the better play is a non-directional structure (a Debit Butterfly or Debit Condor near the Close Zone™) rather than trying to force a directional read.
The canonical mistake is trying to apply Footprint analysis to every session. Institutional Order Flow analysis is designed for trending markets. Applying it to range days produces false signals. SPXXL's engine knows the difference.
07The Honest Takeaway
Footprint Charts are powerful. If you trade ES or NQ futures, learn them — they are the gold standard. But if you trade SPX 0DTE options, the raw data isn't there, and pretending it is will lead you to build convictions on data you don't actually have.
I built SPXXL to read the same story a different way — through the observable effects that institutional Order Flow leaves behind in the SPX regime. The new 6-Step Order Flow Confirmation widget is the result. It won't replace a Footprint Chart for an ES trader. But for SPX 0DTE, it reads the day's conviction honestly — and tells you when there's nothing to read.
See the 6-Step Read on a live session.
Five full trading days of Elite access. No cost. Nothing to cancel.
The market opens again tomorrow and a new session gets classified.
This article is educational and uses SPX for illustration — it is not financial advice, and no outcome is predicted or guaranteed.