
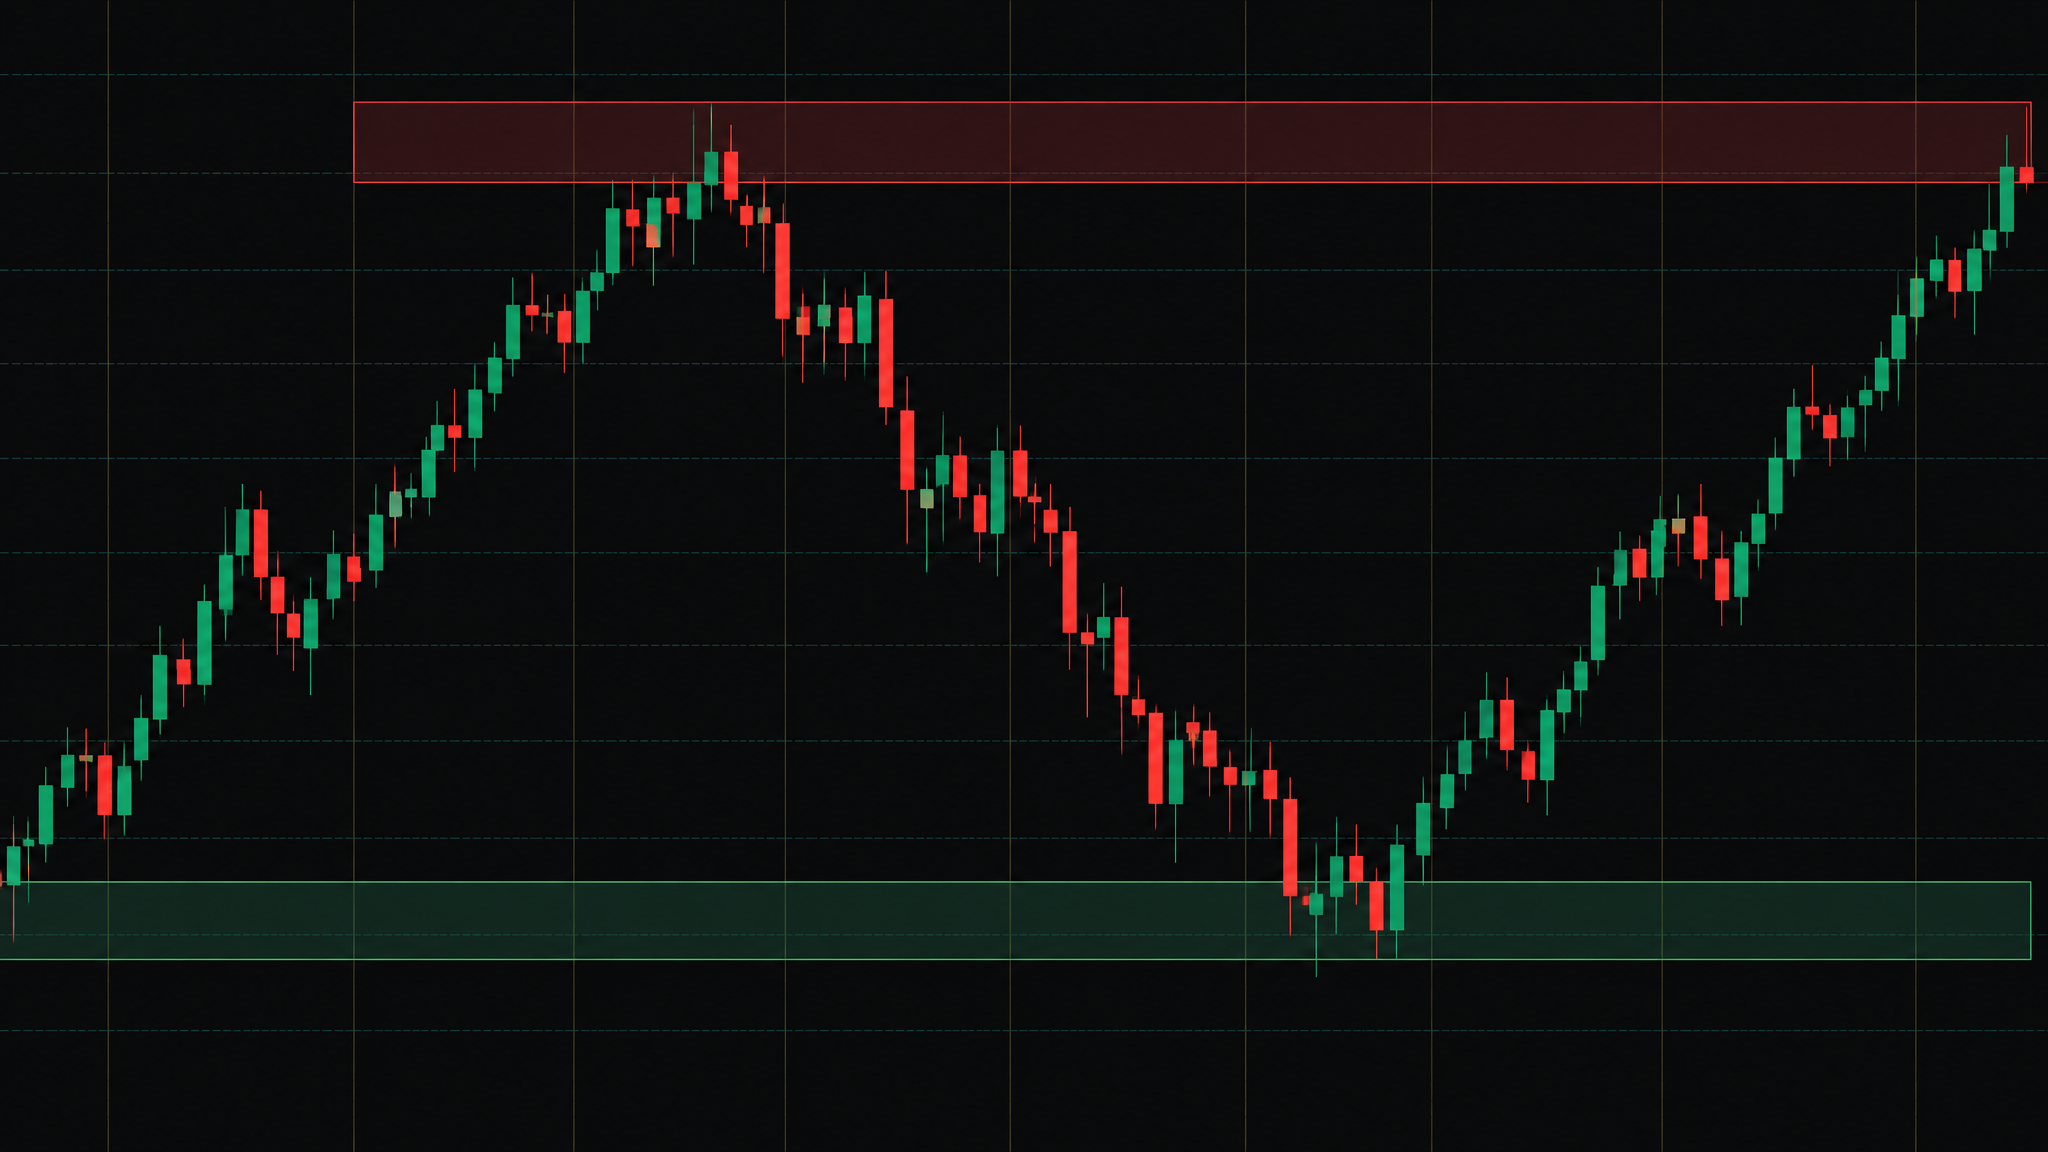
01The Box That Costs You Money
Open any chart and you can draw a supply and demand zone in about four seconds: find a spot where price turned, drag a box around it, and wait for price to come back. It feels like edge. It looks like the institutions. And most of the time, it is worth nothing.
Here is the uncomfortable truth: the overwhelming majority of the zones retail traders draw are fake. Not because supply and demand is a myth — it is the most honest way to read a market — but because the box on your screen is missing the one thing that makes a zone real. A drawing is not a decision.
The single idea this whole article turns on is this: a zone is a LOCATION, not a signal. Drawing a box does not make sellers show up. The box marks where selling once won — it says nothing about whether anyone is still home the next time price knocks. Everything that follows is how you tell the difference.
02What a Real Zone Actually Is
A real zone starts with a story about size. When a large institution wants to sell, it cannot dump the whole order at one price without moving the market against itself. So it fills what it can, price rips away, and a pool of unfilled orders is left behind at the origin. When price drifts back to that origin later, the theory is that the leftover orders may still be resting there — ready to press price the same way again.
That origin is the base: the tight little consolidation that sits immediately before an aggressive, one-directional move. A Supply Zone is the base right before a hard drop. A Demand Zone is the base right before a hard rally. You draw the box from that base — not from the wick of the impulse candle, and not from every wiggle where price happened to pause.
So far this is textbook. The problem is that a base by itself proves nothing. Consolidations happen constantly, and price leaves most of them without leaving any orders behind. To know a base is worth watching, you need proof that real size was in control — and that is the test almost nobody applies.
03The Birth Certificate: No Swing Break, No Valid Zone
Here is the filter that removes most fake zones in one move: the departure from the base must break structure. When price leaves a real base, it does so with enough force to break the most recent swing point — a prior swing low for a Supply Zone, a prior swing high for a Demand Zone. That is the Swing Break, and it is the zone’s birth certificate.
Think about what a Swing Break actually tells you. Any spot where price paused and turned looks like a zone in hindsight. The Swing Break is the evidence that someone with size was genuinely in control there — the difference between a coincidence and a footprint. If price merely drifted away from a base without breaking structure, there is no proof of control, and the box should never be traded.
Stated plainly: no Swing Break, no valid zone. Apply that one rule honestly and you will delete most of the boxes on your chart before you ever place a trade. Good. Those were the ones about to cost you money.
04The First-Touch Trap
Say you have done the work: a real base, a clean Swing Break, a Fresh zone. Price is heading back toward it. Now comes the most expensive habit in zone trading — entering the instant price touches the box, because the touch feels like the trade.
It is not. Picture a house with the lights off. Price returning to the zone is the knock at the door. Whether the door opens — the reaction — is what tells you if anyone actually lives there. Entering on the touch is deciding someone is home just because you knocked. Sometimes they are. Often the house is empty and price walks straight through your stop. That is the First-Touch Trap.
The fix is mechanical: wait for the Reaction Candle. It has a two-part test:
The 25% close
On a return to a Demand Zone, the candle must close in the TOP 25% of its own range — a decisive rejection of lower prices. At a Supply Zone, it must close in the BOTTOM 25%. A mid-range close is indecision, not a reaction.
The structure break
The reaction must also break a minor swing point in the immediate structure — proof the rejection had enough force to shift the short-term balance, not just print one hopeful wick.
A zone with no reaction is a drawing. A zone with a reaction is a decision. Never enter on the touch — enter on the reaction.
05Every Zone Is a Battery
Even a perfect zone does not last forever. Each zone holds a finite pool of resting orders, and every time price returns and interacts, some of that pool is spent. Picture a battery: fresh out of the pack it is fully charged, and every touch drains it a little more until there is nothing left. That is the Zone Life Cycle, and it has five stages.
Fresh
Untouched since it formed. Full charge, highest-odds reaction — the resting orders have not been spent.
Tested
Returned once and reacted. Still valid, but partially drained; the next reaction is usually weaker.
Weakened
Multiple touches. The orders are mostly gone; reactions get shallow and unreliable.
Dead
The pool is exhausted. Price slices straight through with little pause. Trading a Dead Zone is the third classic way traders lose — after fake zones and first-touch entries.
Flipped
The Dead Zone breaks and reverses role: failed Demand becomes Supply, failed Supply becomes Demand.
That last stage is worth its own moment. When a Demand Zone breaks, everyone who bought it expecting support is now underwater. As price rallies back to the broken level, those trapped longs are desperate to exit at breakeven — so they sell into the return. You are, quite literally, trading against a room full of trapped traders hitting the exit at the same price. Their forced selling is what turns old support into new resistance. That is a Zone Flip, and a confirmed one is among the highest-conviction reads there is, because it is powered by forced flow rather than opinion.
The takeaway: freshness is edge. Counting touches is not optional — it is how you avoid selling into a wall that is already spent.
06The SPX Problem: You Cannot See the Order Book
Now the honesty most zone courses skip. The entire supply and demand story rests on resting orders at a price. On futures like the E-mini, a trader can at least watch that order flow on a centralized tape. On SPX, that tape does not exist.
SPX options trade across a fragmented electronic market with no single feed of every resting bid and offer. So nobody — not you, not your favorite indicator, not SPXXL — can literally see raw supply and demand sitting at 6000 the way the textbook diagram implies. Pretending otherwise is exactly how fake zones get drawn: a box justified by an order book you were never able to see.
That does not make the concept useless. It means you have to read the market’s effects and its structure instead of an order book that is invisible — and you have to build your levels from data you can actually measure.
07How SPXXL Scores the Other 20%
This is the whole reason the engine exists. Instead of asking you to eyeball a box and hope, SPXXL builds a Computed Zone — a level derived from measurable data rather than drawn by hand. Ten traders draw ten different boxes; the engine produces one objective, repeatable level. The measurable inputs behind it:
Call Wall & Put Wall
Dealer-hedging concentrations that tend to cap price (overhead supply) and support it (underlying demand).
Gamma Flip
The level where dealer hedging switches from dampening moves to amplifying them — a regime line, not just a price.
VWAP & deviation bands
The session's volume-weighted fair value and its acceptance edges — where price is stretched from equilibrium.
Initial Balance & Close Zone
The first-hour range that frames the day, and the engine's projection of where SPX is likely to settle at 4:00 PM ET.
The strongest Computed Zones are the confluence pockets — where several inputs stack at one price. A Put Wall sitting on VWAP support inside the lower Initial Balance edge is the machine-read equivalent of a Fresh, Swing-Break-validated Demand Zone. That overlap is the “other 20%” worth trading.
And every rule from the hand-drawn method still applies. A Computed Zone still needs a Reaction Candle before you act, still ages through a life cycle, and can still Flip when broken. The difference is that SPXXL also tells you — through its confidence and SIT-OUT readings — when there is simply nothing worth trading, which is a feature retail zone drawing never had.
08The Six-Step Zone Checklist
Put the whole framework on one card. Before any zone earns a defined-risk trade, it has to pass all six:
1. Source
Is there a real base — a tight consolidation before an impulsive move — or just a random wiggle?
2. Swing Break
Did the move away break structure? No Swing Break, no valid zone. This is the birth certificate.
3. Life Stage
Fresh or Tested justifies a look. Weakened demands caution. Dead is a stand-down. Flipped is traded the new way.
4. Reaction
Wait for the Reaction Candle — a close in the top or bottom 25% of range plus a minor structure break. Never the touch alone.
5. Stop
Placed beyond the point that would invalidate the zone. If price gets there, the read was wrong — accept it.
6. Target
The next opposing zone, with a 2R floor. If the reward to the next zone is not worth at least twice the risk, pass.
On SPX, you express that read with a defined-risk structure. A confirmed bullish reaction off demand fits a vertical debit call spread; a confirmed bearish reaction off supply fits a vertical debit put spread. Either way the debit you pay is the most you can lose — a 1.50 debit is $150 per contract at risk, no matter what the market does next. That is how you trade zones without letting one empty house take the account.
See the Computed Zones on a live session.
Five full trading days of Elite access. No cost. Nothing to cancel.
The market opens again tomorrow and a new session gets classified.
This article is educational and uses SPX for illustration — it is not financial advice, and no outcome is predicted or guaranteed.