The Close Zone™ Intelligence Engine:
How Temporal Confidence Rewrites 0DTE
Every other close-prediction tool gives you a number and asks you to trust it. SPXXL Close Zone™ gives you a 3-layer temporal intelligence architecture — extracting streaks, transitions, and convergence from 390 bars of live session data, scoring confidence through a sigmoid function calibrated to real market behavior, and surfacing it all in an interactive intelligence panel you can interrogate in real time.
This isn't a confidence number. It's a confidence autopsy — and it changes everything about how you trade 0DTE debit spreads.
The Problem: Confidence Without Intelligence
Every 0DTE contract expires at the close. Your debit spread, your debit butterfly, every structure you deploy — the final SPX print determines if it pays out or dies worthless.
Most close-prediction tools give you a single confidence number. "72% confident." But confident in what? Based on what evidence? Is that 72% rising or falling? Is the session stable or chaotic? Are the last 60 bars confirming or contradicting the first 200?
A confidence number without intelligence behind it is just a decorated guess. You can't trade a number you can't decompose.
The old approach treated session classification as a single vote — "it's a Balanced Day, trust the projection." But sessions evolve. They streak, they transition, they converge or diverge. A static label thrown at bar 100 tells you nothing about what happened over the next 200 bars.
SPXXL Close Zone™ solves this with a 3-layer temporal confidence architecture that doesn't just classify — it understands the entire temporal evolution of the session.
The 3-Layer Architecture
Temporal Confidence Intelligence is built as a pipeline — each layer feeds the next, creating a system where raw session data becomes decomposable conviction:
Extracts temporal patterns from every bar of the session — streaks, transitions, convergence, recency-weighted dominance — and caches them with 2-minute TTL for real-time access.
Feeds temporal patterns through a calibrated sigmoid function and combines with 8 other factors to produce a confidence score where 50% dominance ≠ 50% confidence — because markets don't work linearly.
Surfaces the full confidence breakdown — all 9 factors scored, temporal metadata ribbon, stability classification — so you can interrogate why confidence is what it is, not just what it is.
Every layer is transparent. Every score is decomposable. You never have to trust a black box.
Layer 1 — The 390-Bar Temporal Extraction Engine
Every trading session is 390 one-minute bars. Layer 1 doesn't just ask "what session type is this?" — it builds a complete temporal fingerprint by analyzing every classification across the entire session.
Think of it as reading the session's autobiography, not just its name tag.
Here's what the temporal extraction engine computes from the rolling session classification:
Current Streak
How many consecutive bars the dominant session type has held. A 45-bar Balanced Day streak means stability. A 3-bar streak after a transition means uncertainty.
Longest Streak
The longest unbroken run of any single session type during the session. Long streaks = the market committed. Short longest-streaks = the session can't decide what it is.
Transition Count
How many times the dominant session type changed. 2 transitions in 300 bars = rock solid. 15 transitions = the session is chaotic. This directly determines stability classification.
Recency-Weighted Dominance
The last 60 bars get 2× the weight of earlier bars. Why? Because a session that was Balanced Day for 200 bars but has been trending for the last 60 is a Trend Day now — the recent bars matter more.
Convergence Delta
Compares the first-half session type ratio vs the second-half ratio. Positive convergence = the session is reinforcing its identity. Negative = it's diverging, weakening conviction.
Trailing Agreement
Does the recent dominant type agree with the cumulative dominant type? When trailing agrees with cumulative, the temporal signal is unified. When they disagree, the session has shifted.
All six metrics are computed in real time and cached with a 2-minute TTL — fresh enough for live trading, efficient enough to avoid redundant computation. This cache is the foundation that Layer 2 builds on.
Layer 2 — Sigmoid-Scaled 9-Factor Confidence Scoring
Layer 2 takes the temporal patterns from Layer 1 and transforms them into a single, decomposable confidence score between 10 and 95 — using 9 weighted factors, each with a specific role:
| Factor | Max Points | What It Measures |
|---|---|---|
| Base Score | 5 | Every projection starts here — the floor |
| ★ Timeline Consistency | +30 | Sigmoid-scaled session dominance from Layer 1 temporal cache |
| Timeline Stability | +10 | Inverse of transition count — fewer switches = more stable |
| Convergence Trend | +8 | First-half vs second-half type ratio convergence |
| Score Conviction | +12 | Combined clarity + separation of the session score |
| Time Progress | +15 | Later in the session = more data = higher conviction |
| Engine Confidence | +8 | The underlying classification engine's own certainty |
| VIX Regime | ±5 | Low VIX boosts confidence, high VIX dampens it |
| Price Coherence | +5 | VWAP alignment + volume confirmation |
The star factor — Timeline Consistency — is where the sigmoid transformation happens. This single factor contributes up to 30 of the possible ~98 raw points, making temporal stability the dominant driver of confidence.
Range Coherence (±4 points) acts as a guardrail — if the projected zone conflicts with the actual price range, confidence gets penalized. You can't project a close at 5600 when SPX is trading at 5900.
The Sigmoid Advantage: Why Linear Scoring Lies
This is the mathematical heart of temporal confidence — and why SPXXL's numbers behave differently from anything else you've seen.
Most scoring systems are linear: if one session type has appeared 60% of the time, it gets 60% of the timeline score. Sounds reasonable. It's not.
In real markets, 33% dominance is noise. 50% dominance is undecided. 70% dominance is strong. 90% dominance is overwhelming. A linear function treats the jump from 33%→50% the same as 70%→87%. The sigmoid knows better.
SPXXL uses a tuned sigmoid: 1 / (1 + e^(-12 × (x - 0.55)))
Here's what the calibration produces:
33%
~0 pts
Noise
50%
~8 pts
Undecided
70%
~25 pts
Strong
90%
~30 pts
Dominant
The sigmoid is centered at 0.55 with a steepness of 12 — meaning it's nearly flat below 40% dominance (noise gets zero credit) and nearly maxed above 80% dominance (strong signals get full credit). The transition zone between 50-70% is where the sigmoid is most sensitive — exactly where trading decisions are hardest.
This isn't academic curve-fitting. It's calibrated to how session types actually predict closes. A 33% Balanced Day reading has zero predictive value. A 90% Balanced Day reading has massive predictive value. The sigmoid reflects that reality.
Layer 3 — The Intelligence Panel You Can Interrogate
Most dashboards show you a confidence number and stop. SPXXL gives you the Confidence Intelligence Panel — a collapsible section inside the Close Zone™ widget that lays bare every factor contributing to the score.
Open the panel and you see:
Total bars analyzed, transition count, current streak, longest streak, convergence delta, trailing agreement, recency-weighted dominance — all the Layer 1 metrics rendered as interactive chips.
Every factor scored and visualized — Timeline Consistency, Stability, Convergence, Score Conviction, Time Progress, Engine Confidence, VIX Regime, Price Coherence, Range Coherence. You can see exactly which factors are contributing and which are dragging.
Derived from the transition count. ROCK SOLID (≤3 transitions) means the session has barely wavered. CHAOTIC (10+) means the market can't decide what it is. This single badge tells you how much to trust the projection.
The headline number, rendered as an animated arc gauge with color transitions — red below 30, amber 30-60, green above 60. At a glance, you know the conviction level.
The intelligence panel is designed for one question: "Why is confidence at this level?" Open it, scan the bars, check the temporal ribbon — in 3 seconds you know exactly what's driving the number.
This is what separates SPXXL from every other tool in the space. You're not trusting a black box. You're reading the machine's reasoning.
Six Session Profiles, Temporal Pattern Recognition
The temporal engine classifies every bar against six distinct session profiles, each with different closing behaviors and different implications for your debit spreads:
Balanced Day
Mean-reverting, closes near VWAP/IB mid. High-conviction zone for debit butterflies centered on VWAP.
Trend Day
Directional conviction. Closes near the extreme. Narrow zone, shifted projection — directional debit spreads shine.
Expansion Day
Breaks IB with momentum. Zone widens to account for range extension. Wider-wing debit spreads to capture the move.
Short Covering Rally
Mechanical squeeze dynamics. Zone shifts upward as covering accelerates. Call debit spreads target the squeeze.
Liquidity Sweep
Fakes direction, reverses hard. Temporal transitions spike. Wait for the reversal, then deploy debit spreads in the new direction.
Volatility Compression
Range tightening into the close. Zone narrows aggressively. Tight debit butterflies at the compression center.
The temporal engine tracks how the session transitions between these types. A session that starts as Balanced Day, transitions to Expansion Day, then settles back to Balanced Day tells a very different story than one that starts Balanced Day and stays Balanced Day for 300 bars. The streak length, transition count, and convergence delta all capture these dynamics.
When the trailing dominant type agrees with the cumulative dominant type and the convergence delta is positive — that's temporal convergence. The session is reinforcing its identity. That's when confidence climbs fastest and your debit spread placement has the highest conviction.
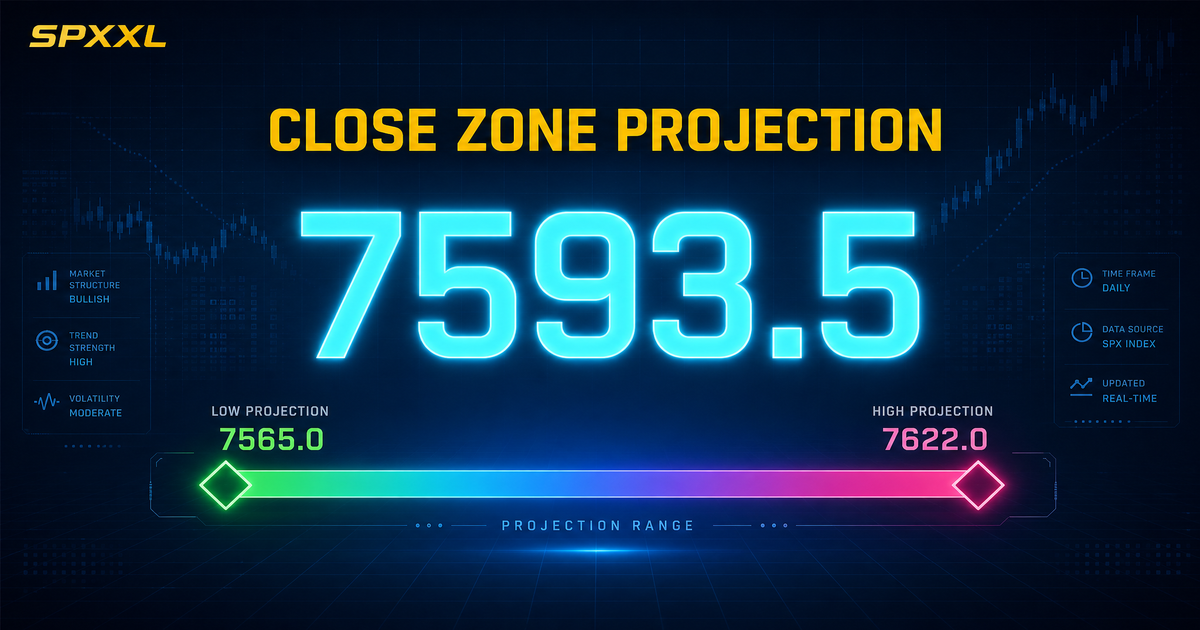
Live Widget — The Full Visual Breakdown
Here's what the complete SPXXL Close Zone™ looks like on a live session — confidence arc, stability badge, GEX walls, zone bar, and the collapsible intelligence panel:
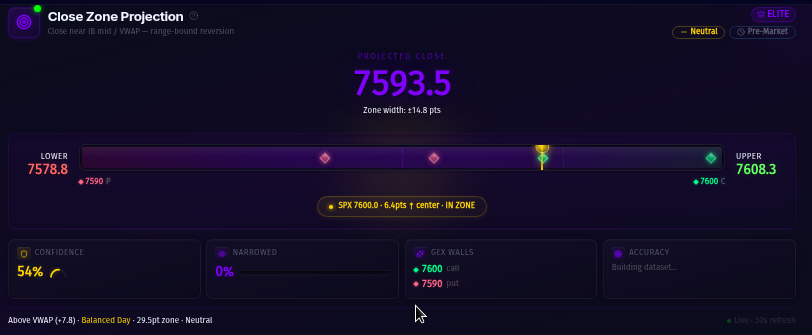
Live session capture: The intelligence panel shows all 9 confidence factors broken down as horizontal bars. The temporal metadata ribbon displays total bars, transition count, current streak, convergence delta, and trailing agreement. Stability badge reads the session's consistency. GEX wall diamonds mark dealer gravity levels on the zone bar.
Every element is actionable:
The sigmoid-scaled composite score from all 9 factors. Color-coded: red (low), amber (moderate), green (high). This is your at-a-glance signal quality indicator.
ROCK SOLID, STABLE, CHOPPY, or CHAOTIC — derived from transition count. Tells you how much to trust the classification before you even look at the confidence number.
Call wall (resistance) and Put wall (support) markers with exact strike prices. When the projected zone aligns with GEX walls, that's convergence between algorithm and market structure.
Upper bound, lower bound, center estimate. Narrows as the session progresses. The live price marker shows IN ZONE, ABOVE, or BELOW.
Expand to see all 9 factors scored, the temporal metadata ribbon, and the factor breakdown chart. This is where you answer 'why is confidence at this level?'
How Temporal Intelligence Changes Your Trading
Temporal Confidence Intelligence doesn't just predict the close — it transforms how you select, time, and size your 0DTE debit spreads:
High confidence + ROCK SOLID stability + convergence positive
Maximum conviction setup. Deploy debit butterflies centered on the projected close. The temporal data is unified — streaks are long, transitions are few, trailing agrees with cumulative. This is the highest-probability zone.
Moderate confidence + STABLE + Timeline Consistency is the top factor
Good setup with caution. Deploy debit spreads but slightly wider wings. The sigmoid is in its sensitive zone (50-70% dominance) — one strong streak could push confidence significantly higher or a transition could drop it.
Rising confidence + convergence delta turning positive
The session is finding its identity. Watch for the stability badge to improve from CHOPPY to STABLE. Once it does, deploy. The convergence signal means early noise is resolving into a pattern.
Low confidence + CHAOTIC stability + high transition count
Sit out or reduce size dramatically. 10+ transitions means the session can't decide what it is. No temporal pattern = no edge. Respect the intelligence panel — it's telling you this session doesn't have a readable structure.
The intelligence panel turns every confidence number into a trading decision framework. You're not asking "is confidence high?" — you're asking "is Timeline Consistency the dominant factor? Is the session stable? Is convergence positive?" Those specific answers drive specific trade structures.
Competitive Comparison — SPXXL vs the Field
Let's be direct about what exists in the market and what doesn't:
| Feature | SPXXL | SpotGamma | Cheddar Flow | TOS Native |
|---|---|---|---|---|
| Temporal Confidence Intelligence | ✓ | — | — | — |
| Sigmoid-Scaled Session Scoring | ✓ | — | — | — |
| 390-Bar Streak/Transition Analysis | ✓ | — | — | — |
| Decomposable 9-Factor Confidence | ✓ | — | — | — |
| Interactive Intelligence Panel | ✓ | — | — | — |
| Projected Close Zone™ | ✓ | — | — | — |
| GEX Wall Overlay on Zone | ✓ | — | — | — |
| Session Profile Classification | ✓ | — | — | — |
| GEX Data (Standalone) | ✓ | ✓ | — | — |
| Live 30s Refresh | ✓ | — | — | — |
Nobody else in the 0DTE space has temporal confidence intelligence. SpotGamma gives you gamma data. Cheddar Flow tracks options flow. Neither decomposes confidence into inspectable factors, neither tracks session streaks or convergence, neither uses sigmoid scaling. SPXXL is the only platform where you can open the confidence panel and understand exactly why the number is what it is.
The individual pieces — GEX data, session labels, confidence numbers — exist elsewhere. But the temporal intelligence layer? The 390-bar streak analysis? The sigmoid-scaled scoring? The interactive decomposition panel? That architecture is uniquely SPXXL.
See Temporal Intelligence Live on Your Dashboard
5 live sessions of full Elite access. Close Zone™, confidence intelligence panel, sigmoid-scaled scoring, temporal metadata, 30-second refresh — everything you've just read about, running live.
5 live sessions of full Elite access · No credit card required