Top Features to Showcase in Your SPXXL Demo Videos
Not all features convert equally. This guide ranks every SPXXL feature by conversion impact and gives you exact talking points to use in your screen recordings. Focus on the features that make your audience say "I need this."
Tier 1: The ‘Must Show’ Features
These features create the strongest "I need this" reaction. Every demo video should include at least one of these:
Session Classification Hero
The dashboard’s main panel showing the current session type (Balanced Day, Trend Day, Expansion Day, Short Covering Rally, Liquidity Sweep, Volatility Compression), confidence percentage, direction, and risk level. This is SPXXL’s signature feature.
What to Say on Camera
- "Right now, SPXXL is classifying this session as [type] with [X]% confidence. This tells me immediately what kind of structures will work today."
- "See that confidence score? When it is above 75%, the session classification has been highly reliable in backtesting."
- "The direction indicator shows [Bullish/Bearish/Neutral] — this is not a guess, it is calculated from seven independent scoring dimensions."
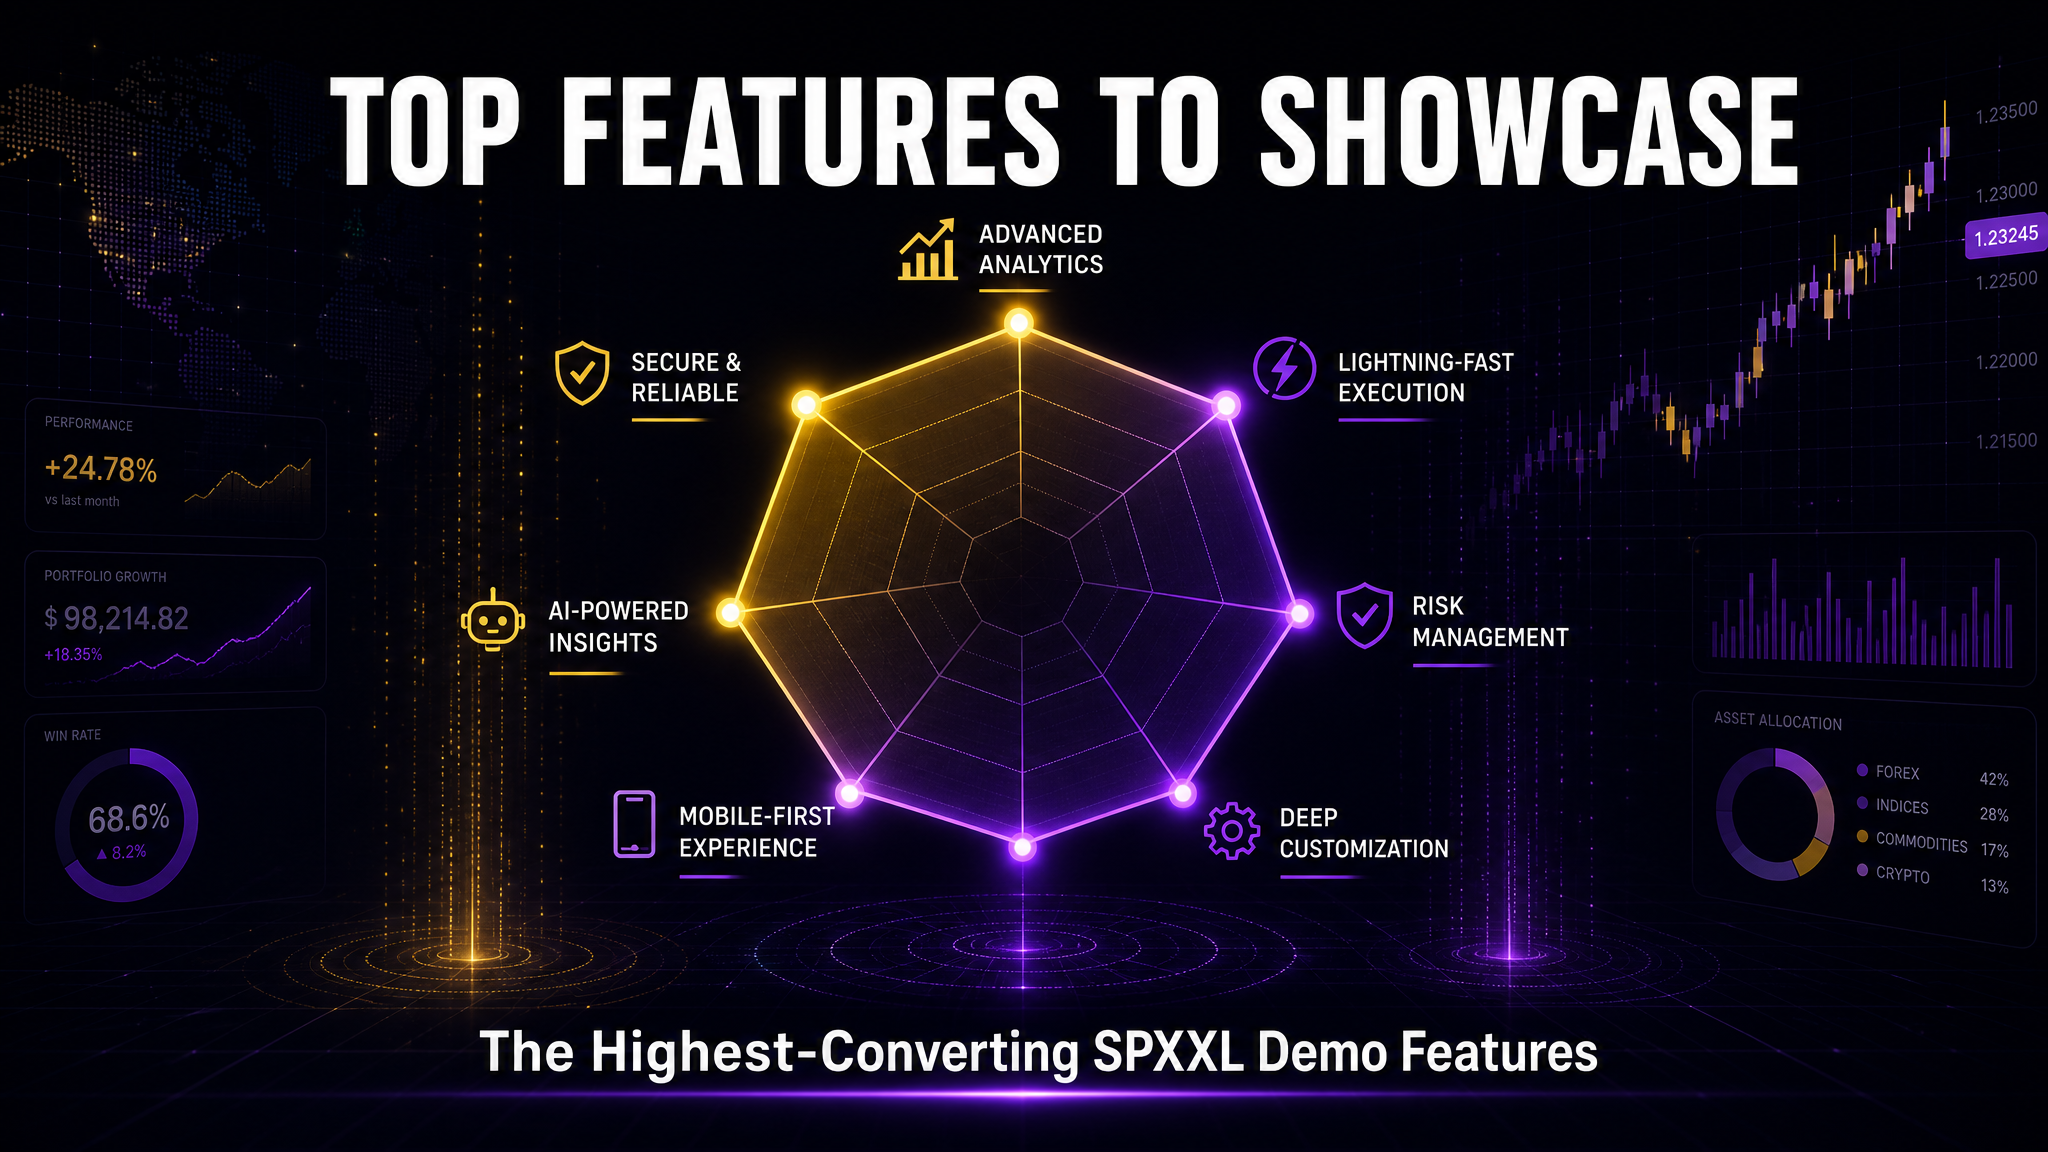
Scoring Radar Chart
Seven-dimension radar visualization showing Price, Time, Volume, Value, Momentum, Volatility, and Liquidity scores. Each axis is 0-100, creating a unique ‘fingerprint’ for the current session.
What to Say on Camera
- "This radar chart shows seven independent scoring dimensions. Look at how [dimension] is spiking right now — that tells me..."
- "Compare this shape to yesterday. See how the Momentum axis was flat yesterday but is extended today? That is a completely different trading environment."
- "Each score is calculated from real market data — actual volume, actual price action, actual volatility. There is nothing subjective here."
Theta Decay Visualization
Live theta decay curve showing how time value erodes throughout the 0DTE session. Annotations mark optimal entry windows, acceleration points, and the terminal theta zone.
What to Say on Camera
- "This curve shows exactly when theta is working hardest in your favor. See that acceleration starting around 1 PM? That is when premium sellers have the biggest edge."
- "If you are trading Debit Spreads, this chart tells you the optimal entry time. Too early and you leave money on the table. Too late and theta decay eats into your position."
- "Most traders guess when to enter their 0DTE trades. This chart removes the guessing entirely."
Tier 2: High-Impact Features
These features deepen understanding and drive conversions for more analytical audiences:
Strategy Builder
Interactive tool for building Debit Spreads and long condors aligned to the current session type. Shows strike selection, spread width, max profit, max loss, and structure alignment.
What to Say on Camera
- "The Strategy Builder takes the session classification and turns it into an actual trade. Watch — it is recommending a [structure type] because the session is [type]."
- "I can adjust the width, see my max profit and max loss instantly, and the platform tells me if this structure aligns with the current session or not."
- "This is the bridge between analysis and execution. You go from knowing the session type to having a specific trade structure in 30 seconds."
Dual-Panel Chart Engine
Professional charting with IB levels, ADR bands, VWAP, and MFE/MAE overlays. TOS-aligned visual language that experienced traders recognize immediately.
What to Say on Camera
- "If you use ThinkorSwim, this will feel familiar. IB levels, VWAP, ADR bands — all the levels that matter for 0DTE, rendered in real time."
- "The MFE/MAE overlay shows you the maximum favorable and maximum adverse excursion for today’s session. This is how you set stop losses and profit targets based on data, not gut feel."
- "Notice how the chart integrates with the session classification above. The levels shift based on whether we are in a Trend vs Balanced Day."
SPXXL Close Zone™
Probabilistic projection of where SPX is likely to close based on current session type, historical patterns, and intraday momentum. Displays as a range with confidence bands.
What to Say on Camera
- "Close Zone™ shows where SPX is most likely to end the day based on the current session type. For a Balanced Day, it projects a tight range near the IB midpoint."
- "This is incredibly useful for setting your exit strategy. If the Close Zone™ is above your target strikes, you know your position is likely safe into expiration."
- "It updates throughout the day as new data comes in. Watch how the range narrows as we approach 3 PM."
Tier 3: Differentiation Features
These features help you create unique content that stands out from generic trading tool reviews:
Weekday Personality Profiles
Historical analysis showing how each weekday behaves differently for SPX — Mondays tend to compress, Wednesdays show Fed effects, Fridays see opex dynamics. Unique content angle.
What to Say on Camera
- "Did you know Mondays trade differently from Wednesdays for SPX? This feature shows you the personality of each weekday based on historical session data."
- "Look at Friday’s profile — see how expansion events cluster in the afternoon? That is options expiration dynamics at work."
- "This is something you will not find in any other trading tool. It helps you adjust your expectations before the session even starts."
Session Evolution Timeline
Visual timeline showing how the session type has evolved throughout the day. Tracks transitions from IB formation through the current state. Shows session stability.
What to Say on Camera
- "This timeline shows the journey of today’s session. We started as Volatility Compression during the IB formation, transitioned to Balanced Day at 10:30, and have been stable for 2 hours."
- "When you see frequent transitions, that is a warning sign — the market hasn’t committed to a session type yet. Wait for stability before entering."
- "Session stability is one of the most underrated edge factors in 0DTE trading. SPXXL makes it visible."
ThinkorSwim Script Integration
SPXXL includes a downloadable ThinkScript study (v2.1) that mirrors the scoring engine directly on TOS charts. This is a major draw for the TOS audience.
What to Say on Camera
- "SPXXL is not just a web platform — it includes a native ThinkorSwim script that runs the same scoring engine directly on your TOS charts."
- "You get the session classification, confidence score, and structure recommendation right in your lower study on TOS. The web dashboard and the TOS script are in sync."
- "For TOS users, this is the ultimate combination — institutional-grade session classification natively in your charting platform plus the full web dashboard for deeper analysis."
Demo Video Sequencing Recommendations
The order in which you show features matters. Here are three proven sequences:
Session Classification Hero → "This tells me exactly what type of day it is" → CTA
Session Classification → Radar Chart → Theta Decay → Strategy Builder → CTA
Session Classification → Radar Chart → Chart Engine → Theta Decay → Strategy Builder → SPXXL Close Zone™ → Weekday Personality → TOS Script → CTA
Ready to Show These Features to Your Audience?
Sign up, explore every feature, and record your first walkthrough. Your referral link earns 20% recurring on every conversion.
5 live sessions of full Elite access · No credit card required
Related Reading
Become an SPXXL Affiliate Educator
The complete guide to teaching 0DTE with SPXXL and earning 20% recurring.
Screen Recording Guide
OBS setup, audio tips, and recording workflow for SPXXL walkthroughs.
Affiliate Earnings Breakdown
Commission math, payout schedules, and real earning scenarios.
The Complete 0DTE Guide
Mechanics, strategies, risk management and session classification.