
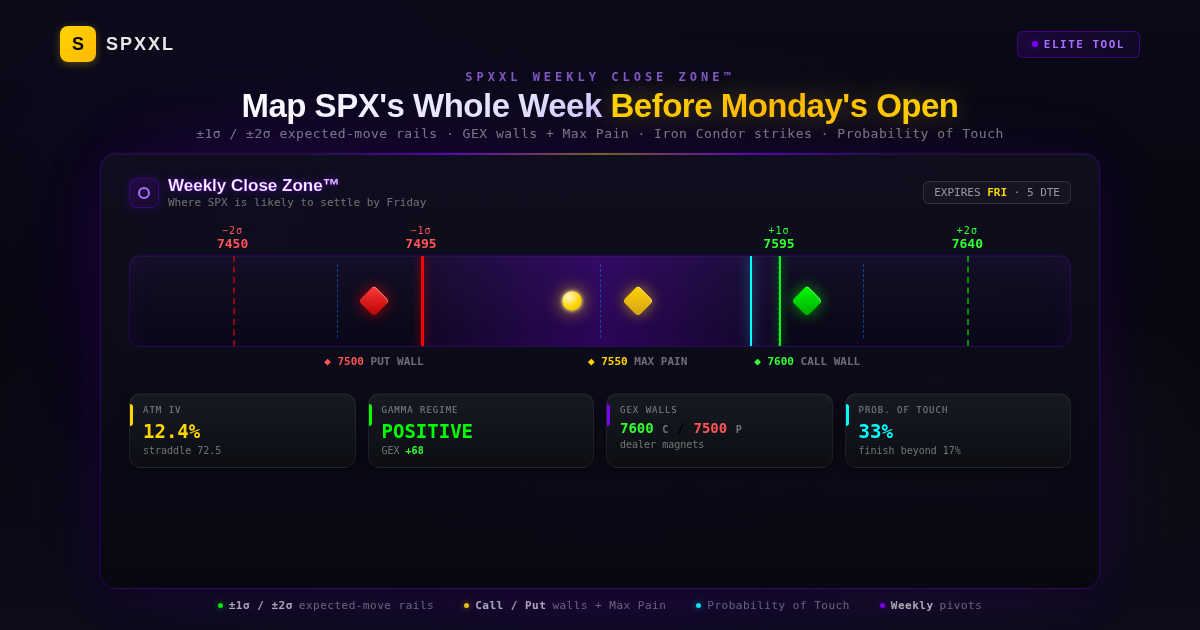
The Problem: Trading the Week Blind
Most traders walk into Monday with a gut feeling and a chart. They know last week's high and low, maybe a round number they're watching — and that's it. Then Wednesday delivers a move nobody "expected," an inner strike gets tested, and the position turns into a stress trade instead of a planned one.
The core issue is that a weekly range isn't one thing — it's the intersection of several forces: how much movement options are actually pricing in, where dealer hedging creates resistance and support, where Friday settlement wants to pin, and where last week's structure left its pivots. Watch only one of those and you're trading with one eye closed.
A weekly range you can't decompose is just a guess with wider error bars. If you can't point to why a level matters, you can't size a trade around it.
The Weekly Close Zone™ solves this by putting every force on one bar — the same expiration, the same price axis — so the map you trade from is complete before the week even starts.
What the Weekly Close Zone™ Maps
The Weekly Close Zone™ is the multi-day companion to the daily Close Zone™. It anchors to the nearest Friday expiration — roughly 5 days to expiration at the start of the week — and layers four independent inputs onto a single horizontal bar:
Derived from at-the-money implied volatility. The ±1σ rails capture about 68% of expected outcomes; the ±2σ rails capture about 95%. This is what the option market itself is pricing for the week.
The Call Wall (resistance) and Put Wall (support) mark where dealer hedging is heaviest, and Max Pain marks the strike Friday settlement tends to gravitate toward. This is market structure, not volatility.
Pivot Point, Resistance 1–3, and Support 1–3 from the prior completed week. Backward-looking geometry that acts as secondary confluence — strongest when it stacks on a rail or a wall.
A first-passage estimate of how likely SPX is to trade through any strike at some point during the week — not just where it finishes Friday. This is the number that governs strike placement and management.
Put together, these four inputs answer a question no single indicator can: where is the week likely to travel, where will it meet resistance, and where do I put my strikes?
The Expected-Move Rails — ±1σ and ±2σ
The rails are the backbone of the Weekly Close Zone™, and they come straight from the option market — not from a model I invented. Specifically, they're derived from the at-the-money straddle price for the weekly expiration.
The ATM straddle price is the market's estimate of a one-standard-deviation (±1σ) move by expiration. Buy the at-the-money Call and Put together, and what you pay is roughly what the market thinks the week is worth in points.
From that single input, the rails fall out cleanly:
±1σ Rails — the 68% band
One straddle above and below spot. SPX finishes inside this band roughly 68% of the time. These are your first-cut Debit Condor inner strikes — the edges of the win zone you want SPX to finish between.
±2σ Rails — the 95% band
Twice the straddle distance from spot. SPX finishes inside this wider band roughly 95% of the time. These are your protective long wings — the outer legs you buy to cap the Debit Condor on both sides.
The 68% Expected-Move Fill
The purple zone between the ±1σ rails is shaded to show the highest-probability travel band. The bulge in the middle is the probability distribution — fatter near spot, thinner toward the rails.
Because the rails are built from live option prices, they breathe with the market. When implied volatility rises — ahead of a Fed meeting or CPI print — the straddle gets more expensive and the rails automatically widen. When the tape is calm, they tighten. You never have to manually adjust for "this looks like a big week." The rails already know.
From Rails to Debit Condor Strikes
Here's where the map becomes a trade. A Debit Condor is four strikes — you buy protective wings on the outside and sell two inner strikes that frame your win zone — and the Weekly Close Zone™ rails place all four for you:
The upper edge of your win zone. Price finishes below this strike about 84% of the time (half of the ~32% that finishes outside the band lands above, half below).
The lower edge of your win zone. Symmetric to the inner Call — together they frame the band SPX must finish inside for maximum profit.
Bought as protection. The distance between your inner Call and this wing shapes the payout — your total risk is capped at the small debit you pay.
Caps downside risk. Buying the wing at the 95% band means you’re protected against all but the most extreme weekly moves.
The edge sharpens when a dealer wall sits just inside a rail. If the Call Wall is a few points below your +1σ rail, set your inner Call there instead — dealer hedging tends to cap price at the wall, giving you a structural reason to expect it holds, not just a statistical one.
This is the difference between "I opened a Condor at strikes that felt about right" and "I built a Debit Condor with its inner strikes at the 68% expected-move band, tightened to a dealer wall, and wings at the 95% band." Same trade structure — completely different conviction.
Dealer Gamma — Call Wall, Put Wall, Max Pain
Volatility tells you how far price can travel. Dealer gamma tells you where it meets friction. These levels come from the concentration of open interest and dealer hedging obligations, and the Weekly Close Zone™ marks three of them:
Call Wall
The strike with the heaviest positive dealer gamma above spot. Acts as resistance — dealers sell into strength here, slowing rallies. A natural ceiling for the week.
Put Wall
The equivalent below spot. Acts as support — dealer hedging buys weakness here, cushioning selloffs. A natural floor for the week.
Max Pain
The strike where the most option premium expires worthless. Price often drifts toward it into Friday settlement as dealers hedge toward the pin.
Gamma Regime
Whether net dealer gamma is positive (dealers dampen moves, ranges compress) or negative (dealers amplify moves, ranges expand). Sets the tone for the whole week.
When the Gamma Regime is positive, the Call Wall and Put Wall tend to hold — dealers are actively dampening moves, so range-bound Debit Condors work well. When it flips negative, walls become breakable and moves accelerate through them — widen your wings or stand aside.
The magic is in the overlap. When the Put Wall lines up with the −1σ rail, you have two independent forces — volatility pricing and dealer structure — pointing at the same level. That's the highest-conviction inner strike the week can offer.
Weekly Pivots as Confluence (Not Gospel)
The Weekly Close Zone™ also plots the classic floor-trader pivots for the week, computed from the prior completed week's high, low, and close:
Pivot Point = (High + Low + Close) ÷ 3
From the Pivot Point, the formula projects Resistance 1, Resistance 2, Resistance 3 above and Support 1, Support 2, Support 3 below. These are the levels a generation of floor traders watched, and they still attract order flow today.
Here's my honest, high-conviction stance: on SPX, pivots are secondary. The expected-move rails and dealer walls are the primary drivers because they reflect what the market is pricing and hedging right now. Pivots are backward-looking geometry from last week.
That doesn't make them useless — it makes them confluence tools:
Strongest — stacked on a rail or wall
When Resistance 1 sits right on top of the +1σ rail or the Call Wall, that level just earned a third vote. Trade it with confidence.
Weakest — standing alone
A pivot floating in empty space between rails, with no wall nearby, is the least reliable level on the bar. Note it, but don’t build a trade around it by itself.
I show the full pivots on purpose — not because they outrank volatility and gamma, but because confluence is where conviction is built. When three independent methods agree on a level, that level is telling you something real.
Probability of Touch — The Number That Saves Trades
This is the tool that changes how you manage weekly positions. Most traders think about the odds of a strike finishing in the money on Friday. But a Debit Condor doesn't just get tested at Friday's close — it can get tested any day of the week.
Because price has all week to wander, the probability of touching a level is roughly double the probability of finishing beyond it. A strike with a 15% chance of expiring in the money has about a 30% chance of being touched at some point. That gap is what tests your nerve on Wednesday.
The Weekly Close Zone™ has a built-in Probability of Touch calculator. Pick any strike and it does two things:
The strike you’re evaluating is dropped onto the weekly bar as a cyan touch marker, so you see exactly where it sits relative to the rails, walls, and pivots.
Using the weekly expected move, it estimates the odds SPX trades through that strike at any point before Friday — the true risk your inner strike faces mid-week, not just at expiration.
Practically, this means you stop being surprised. If your inner Put sits at a 28% touch probability, you already know there's better than a one-in-four chance it gets tested — so you plan the adjustment before you enter, instead of reacting in a panic when it happens.
Live Widget — The Full Weekly Map
Here's the complete Weekly Close Zone™ on a live week — expected-move rails, dealer walls, Max Pain, weekly pivots, stat cards, and the Probability of Touch marker, all on one bar:
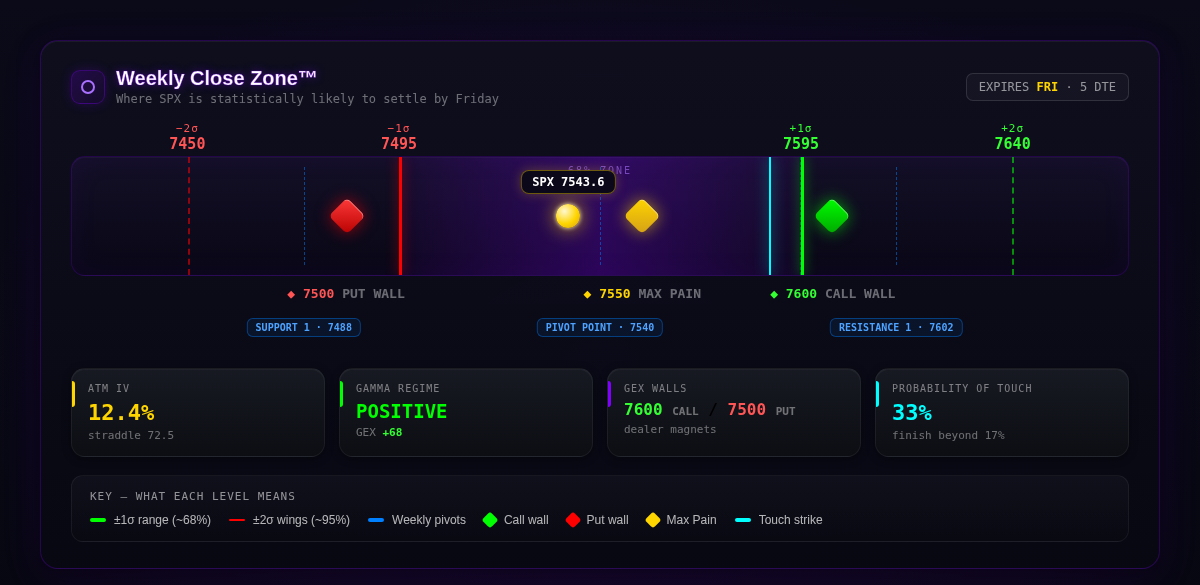
Live weekly capture: The bar spans the ±2σ range with the 68% expected-move zone shaded in the center. Call Wall and Put Wall mark dealer resistance and support, Max Pain marks the Friday settlement magnet, and weekly pivots overlay as secondary confluence. Stat cards read ATM implied volatility, gamma regime, GEX walls, and probability of touch.
Every element is actionable:
The volatility skeleton of the week. Inner rails are your inner (sold) strikes, outer rails your long wings. Everything else is read relative to these.
Green resistance ceiling, red support floor. When they overlap a rail, that level becomes the week’s strongest inner strike.
The gold marker price tends to drift toward into Friday. Useful for anticipating end-of-week pinning behavior.
Floor-trader geometry from last week. Secondary confluence — strongest when stacked on a rail or wall, noted but not traded alone.
The cyan strike marker with its live touch probability. This is how you pressure-test an inner strike before you commit to it.
How to Trade the Weekly Close Zone™
The weekly map turns into specific, repeatable playbooks depending on what the levels are telling you:
Positive gamma regime + walls inside the ±1σ rails
The classic weekly Debit Condor. Set the inner Call at the Call Wall (just inside +1σ), the inner Put at the Put Wall (just inside −1σ), wings at ±2σ. Dealers are dampening moves and structure caps both ends — the highest-probability Condor the week offers.
A pivot stacks perfectly on the +1σ rail and Call Wall
Triple confluence on the upside. This is your anchor for the upper (inner-Call) edge of a Debit Condor — three independent methods agree the level should hold. Trade it with full conviction.
Inner strike shows a 30%+ Probability of Touch
Plan the adjustment before you enter. Either move the strike out toward ±2σ for a lower touch probability, or pre-define the roll/close level. High touch probability isn’t a veto — it’s a heads-up to manage actively.
Negative gamma regime + Max Pain far from spot
Respect the risk. Dealers are amplifying moves, walls are breakable, and price may chase Max Pain across a wide gap. Widen wings dramatically or sit the week out — the map is telling you range-bound Debit Condors have no edge here.
You're never asking "what feels like a good range?" — you're asking "where do volatility, dealer structure, and pivots agree, and what’s the touch probability on my inner strike?" Those specific answers build specific trades.
Competitive Comparison — SPXXL vs the Field
Let's be direct about what exists in the market and what doesn't:
| Feature | SPXXL | SpotGamma | Cheddar Flow | TOS Native |
|---|---|---|---|---|
| Unified Weekly Close Zone™ Bar | ✓ | — | — | — |
| ±1σ / ±2σ Expected-Move Rails | ✓ | — | — | ✓ |
| Debit Condor Strike Mapping | ✓ | — | — | — |
| Call Wall + Put Wall Overlay | ✓ | ✓ | — | — |
| Max Pain Settlement Magnet | ✓ | ✓ | — | — |
| Weekly Floor-Trader Pivots | ✓ | — | — | ✓ |
| Built-in Probability of Touch | ✓ | — | — | — |
| Gamma Regime (Positive / Negative) | ✓ | ✓ | — | — |
| All Forces on One Price Axis | ✓ | — | — | — |
| Live Refresh | ✓ | — | ✓ | ✓ |
The individual pieces exist elsewhere. SpotGamma gives you gamma walls and Max Pain. Your broker platform can draw an expected move or pivots. But nobody fuses implied-volatility rails, dealer walls, Max Pain, and weekly pivots onto one strike-ready bar with a built-in Probability of Touch read. That synthesis is uniquely SPXXL.
Trading is hard enough without stitching four tools together in your head every Monday. The Weekly Close Zone™ does the synthesis for you — one bar, every force, strike-ready.
Map Next Week Before Monday’s Open
5 live sessions of full Elite access. Weekly Close Zone™, expected-move rails, dealer walls, Max Pain, weekly pivots, and the Probability of Touch calculator — everything you've just read about, running live.
5 live sessions of full Elite access · No cost