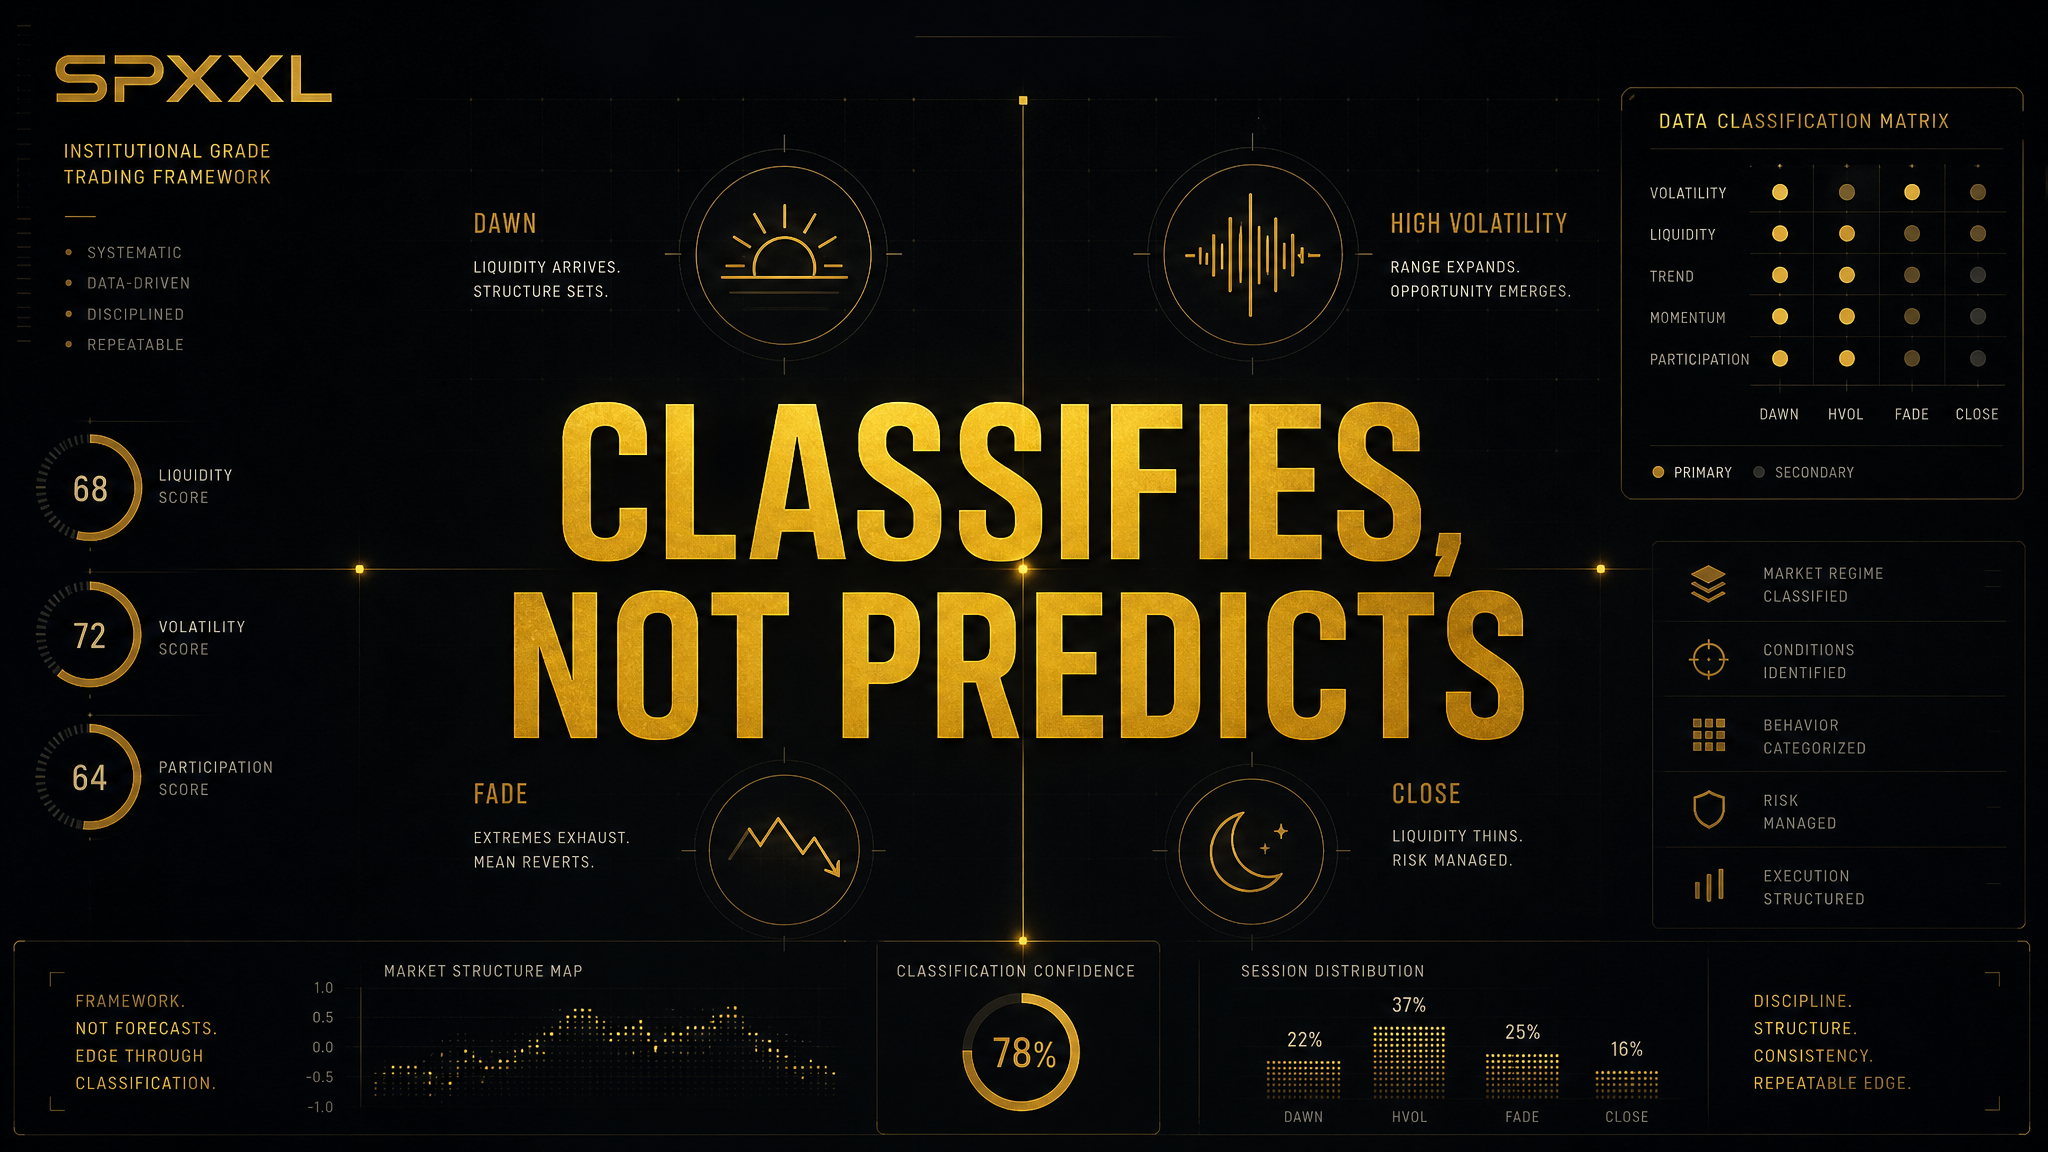
Why SPXXL Classifies,
Not Predicts
Prediction is a seductive trap. It feels like the pinnacle of market mastery — calling the next move before it happens. But the best systematic traders in the world don't predict. They classify the current environment and let their process dictate the response. Here's why SPXXL was built on that same principle.
The Prediction Trap
Every retail trader starts in the same place: Where is SPX going today?
It's an instinct. You open a chart, look at the futures, read some headlines, check what the overnight session did. You form a view: bullish or bearish. Then you construct a trade that profits if you're right.
This is prediction. And it feels natural because our brains are wired for it — pattern recognition evolved to keep us alive. But markets aren't predators on the savanna. They're complex adaptive systems with millions of agents, feedback loops, and information cascades that make point predictions functionally impossible.
Here's the uncomfortable truth: if your trading process requires you to be right about direction, you've built a system that depends on something you cannot reliably control.
The best traders — the ones running multi-million dollar systematic books — figured this out decades ago. They don't predict. They classify, react, and manage.
What Classification Actually Means
Classification is fundamentally different from prediction. Prediction asks: “What will happen next?” Classification asks: “What is happening right now?”
🔮 Prediction
"SPX will close +0.3% today because futures are green and the VIX is down."
🔬 Classification
"Current session structure shows Balanced Day characteristics — 72% confidence — with compression range and mean-reverting VWAP behavior."
The difference is enormous. A prediction is a bet on an outcome. A classification is a measurement of the present state — and from that measurement, you select the structure that has historically performed well in that specific regime.
You're not saying “the market will go up.” You're saying “the market is currently behaving like this type of day, and when it behaves like this, these strategies have a 93% historical win rate.”
One requires clairvoyance. The other requires a good sensor.
Computational Irreducibility: Why Markets Can't Be Predicted
There's a concept from theoretical computer science — popularized by Stephen Wolfram — called computational irreducibility. It states that some systems are so complex that the only way to determine their future state is to run the system itself. There is no shortcut. No formula. No closed-form solution.
Markets are computationally irreducible. Every price at every moment is the output of millions of agents — algorithms, institutions, retail traders, central banks, geopolitical actors — each reacting to each other's actions in real time. The system computes its own future as it unfolds. You cannot skip ahead.
This isn't a limitation of our models or data. It's a fundamental property of the system itself. Markets are not hard to predict because we lack information — they're hard to predict because prediction is mathematically impossible for systems of this complexity.
Dr. Samir Varma, a particle physicist turned systematic trader, understood this instinctively. His background in quantum mechanics — where probabilistic states replace deterministic outcomes — mapped directly to how markets actually work. You don't predict which slit the photon goes through. You characterize the probability distribution and design your experiment accordingly.
SPXXL is built on this same insight. We don't try to solve an unsolvable equation. We measure the observable properties of the current session and classify what regime the market is in right now.
The Particle Physicist's Insight
There's a reason so many great systematic traders come from physics, not finance. Finance teaches you to build models that output a price target. Physics teaches you to measure, classify, and respond probabilistically.
A physicist doesn't walk into the lab and say “the particle will be at position X at time T.” They say “given these boundary conditions, the probability distribution looks like this, and our instrument is optimized for this regime.”
That's exactly what SPXXL does. Our scoring engine measures seven dimensions of the current session in real time:
- Price action relative to VWAP (directional bias)
- Range expansion vs. ADR (energy of the session)
- Volume relative to trailing averages (participation)
- Wick structure and body ratios (rejection vs. acceptance)
- Net move magnitude and direction (conviction)
- VIX regime context (volatility environment)
- Breadth participation (broad vs. narrow market)
From these measurements, the engine classifies the session into one of six archetypes — each with a different probability distribution for where price is likely to close and which structures have edge.
Six Session Types, Not Six Forecasts
The six session types — Balanced Day, Trend Day, Expansion Day, Short Covering Rally, Liquidity Sweep, and Volatility Compression — are not predictions. They're descriptions of market behavior regimes.
When SPXXL says “Balanced Day — 78% confidence,” it is not predicting that SPX will finish flat. It's saying: the current observable market behavior — range, volume, VWAP interaction, wick structure — is consistent with how Balanced Days have historically behaved through the session.
And Balanced Days have specific, statistically measurable properties:
- Range stays within 0.5–0.95× ADR
- Price oscillates around VWAP (mean-reverting)
- Net move is small (<0.25%)
- Debit condors and butterflies centered near VWAP have historically high win rates
You don't need to predict where SPX closes. You need to correctly identify what kind of day this is, and then deploy the structure that thrives in that environment. The structure does the work. You just have to match it to the regime.
Classification turns a directional bet into a regime-matching problem. And regime matching is something that can be systematized, backtested, and improved — unlike gut-feel prediction.
Process Over Outcome
One of the most destructive habits in trading is judging your decisions by their outcomes. A bad trade that makes money reinforces bad behavior. A good trade that loses money erodes confidence in a working system.
Classification-based trading forces a process-first mindset:
- 01The engine classifies the session. You don't override it with “but I think...”
- 02The classification suggests structures. You pick from the recommended set.
- 03You size according to your risk rules. No hero trades.
- 04You log whether you followed the process — regardless of P&L.
- 05Over time, you measure process adherence separately from win rate.
This is why SPXXL's trade journal includes a “Did you follow your process?” toggle. It's not a trivial feature. It's the core of the entire philosophy: separate the quality of your process from the randomness of any single outcome.
Over a large sample, traders who follow the classification-based process consistently outperform those who override it — even when the overrides occasionally work. The math always wins.
The "Leech on the Whale" Principle
Retail traders obsess over finding their own signals. But the most efficient approach is to ride the flows that institutional players create.
When market makers sell options to retail, they must delta-hedge. That hedging creates mechanical, predictable flows: buying dips in positive gamma environments, selling rallies. When large funds rebalance, they create temporary microstructure dislocations.
You don't need to compete with these whales. You need to classify the wake they leave behind and position yourself accordingly.
🐋 Whale (Market Maker)
Sells 50,000 SPX puts → Must buy SPX on every dip to stay delta-neutral → Creates mechanical support floor
🧬 Leech (You)
Detects positive GEX regime + Balanced Day classification → Sells debit condors near VWAP knowing the floor exists → Captures theta
SPXXL's GEX analysis and session classification are purpose-built for this. We measure the gamma regime, identify the institutional flow pattern, and classify the session type that results from those flows. You're not predicting what the whale will do — you're measuring what they're already doing and riding the current.
Alpha Decay: Why Even Good Models Die
Every model has a shelf life. Market microstructure evolves. Participation patterns shift. What worked in a low-VIX, positive-gamma environment doesn't work in a regime change.
Prediction-based systems are especially fragile here. They fit historical patterns and extrapolate forward — and when the distribution shifts, they blow up spectacularly. This is why so many quantitative funds experience catastrophic drawdowns during regime changes.
Classification is inherently more robust because it doesn't extrapolate — it measures in real time. If the market starts behaving differently, the classification changes. You don't need to retrain the model. The sensor adapts because it's reading the present, not projecting the past.
But even classification systems need monitoring. SPXXL includes an Alpha Decay monitor that tracks rolling 90-day accuracy by session type. If classification accuracy drifts — if Balanced Days start getting misclassified as Compression Days, for example — the system flags it before it impacts your trading.
This is the honest approach to systematic trading: build a good sensor, monitor it continuously, and improve it when the signal degrades. No model is permanent. But a well-monitored classification system is far more durable than a prediction engine.
Confidence Is Not Conviction
When SPXXL displays “Trend Day — 84% confidence,” that is not saying “we are 84% sure SPX will trend today.”
It's saying: the current observable data matches the Trend Day archetype with 84% alignment across our scoring dimensions. Historical backtest shows that when this alignment score is above 80%, the session materializes as a Trend Day approximately 89% of the time.
The distinction matters because confidence is a measure of pattern match quality, not a probability of a specific outcome. High confidence means the current market state is clearly expressing one archetype. Low confidence means the signal is ambiguous — multiple archetypes are competing, or the metrics are sending mixed signals.
In practice, this translates directly to position sizing:
- High confidence (70%+): full position size, aggressive structure selection
- Medium confidence (50–70%): reduced size, wider structures, more defensive
- Low confidence (<50%): minimum size or stand aside entirely
You're not trading on conviction about direction. You're trading on signal clarity. And signal clarity is something you can objectively measure.
What You Actually Control
The philosophical core of classification-based trading is radical acceptance of what you can and cannot control:
✅ You Control
- • Which structure you trade
- • How much you size
- • Whether you follow the classification
- • Your exit rules
- • Whether you log and review
- • Your emotional discipline
❌ You Don't Control
- • Where SPX closes
- • Whether a Fed governor speaks
- • Geopolitical events
- • Dealer positioning shifts
- • Whether your P&L is green today
- • Market regime changes
Prediction-based trading puts your P&L in the “things you don't control” column because it depends on being right about direction. Classification-based trading puts your P&L in the “things you control” column — because over a statistically significant sample, process quality determines outcomes.
Not on any single day. But across 50, 100, 200 sessions — the trader who classifies correctly and follows the playbook will outperform the trader who predicts and reacts emotionally. Every time.
The Real Edge
The edge isn't in knowing what the market will do. It's in knowing what kind of market you're in right now — and having a pre-built response for every regime.
That's what SPXXL provides. Not crystal balls. Not price targets. Not “SPX to 5,800 by Friday” calls. We provide a real-time classification system with a 93%+ historical win rate, backed by 14 months of graded sessions, transparent accuracy tracking, and tools to help you separate good process from good luck.
The traders who last in this business are the ones who stopped trying to predict and started building a process. SPXXL exists to be the classification layer of that process — the sensor that tells you what's happening, the playbook that tells you what to do about it, and the journal that tells you whether you actually did it.
Prediction is a game for pundits and social media. Classification is a game for professionals. We built SPXXL for professionals.
Stop Predicting. Start Classifying.
See the session classification engine in action — your first full trading week is free. No card required.